Knowledge Base Article
How to Use the Donor Retention Calculator
The Donor Retention Calculator is an interactive planning tool that shows how your donor base will grow or shrink over the next five years. A live chart updates instantly as you adjust three simple inputs: how many donors you start with, what percentage come back each year, and how many new donors you add annually.
Where to find it
In the left-hand menu, click Fundraising to expand it, scroll to the Fundraising Tools section, and choose Donor Retention Calculator.
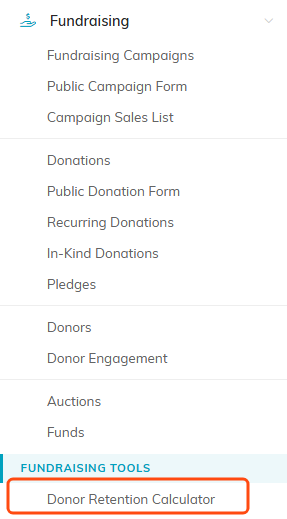
It sits at the bottom of Fundraising, under Fundraising Tools.
Who can open it
You need the Donation Manager, Finance Manager, or Marketing Manager role, or Admin, to open the calculator. It reads your organization's real donor totals, so it is gated the same way as the Donor Retention report.
The menu entry stays visible to anyone with fundraising access, so if you do not hold one of those roles you will still see Donor Retention Calculator listed and will land on the access-denied page when you click it. Ask your Argenta administrator to add the role you need.
How it works
When you open the calculator, it loads your organization's real donor data to set the starting values, and a green Using Your Data badge appears in the card header to tell you so. If you do not have donor data yet, it starts with sensible defaults you can adjust. Either way, you can move every control freely to model different scenarios.
Each year it applies one simple formula: Next Year's Donors = (This Year's Donors x Retention Rate) + New Donors Per Year. For example, with 200 donors, a 70% retention rate, and 40 new donors a year, Year 1 is (200 x 0.70) + 40 = 180, Year 2 is (180 x 0.70) + 40 = 166, and so on across five years.
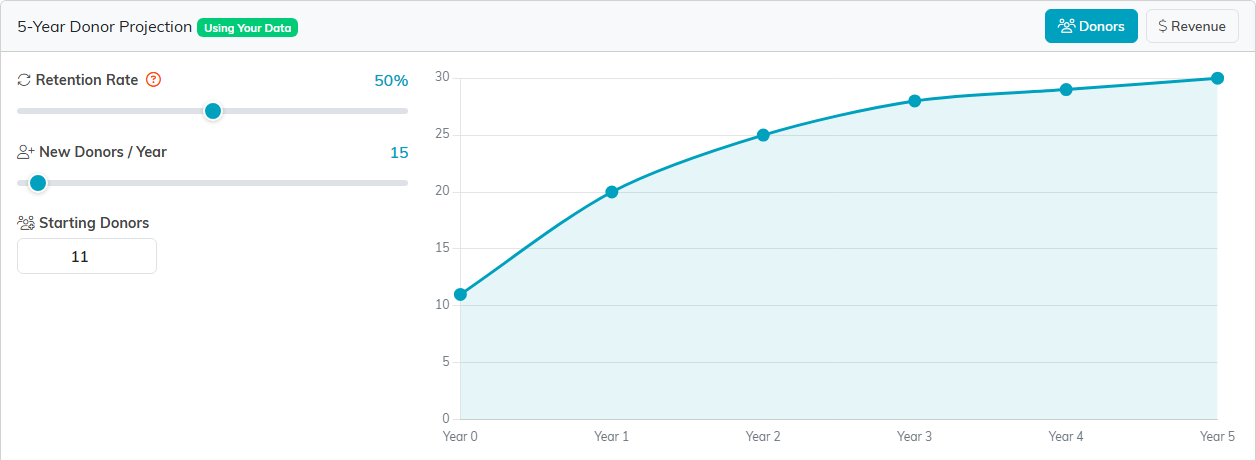
The green badge means the starting values came from your own donor records.
The controls
- Retention Rate (0 to 100%) - The share of donors who give again the next year. Your real rate loads automatically by comparing last year's donors to those who gave again this year.
- New Donors Per Year (0 to 500) - How many brand-new donors you add each year. Loads with the number of new donor records created in the past 12 months.
- Starting Donors - Your Year 0 baseline. Loads with the count of unique donors who gave during the prior calendar year.
- Average Gift - Appears in Revenue mode only; sets the average donation per donor, loaded from your actual average over the past 12 months.
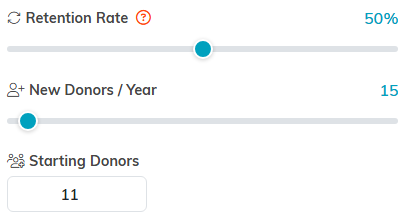
Move any control and the chart redraws as you go.
Donors mode vs. Revenue mode
Use the two buttons at the top of the card to switch views. Donors mode (the default) charts the projected number of donors over five years. Revenue mode charts projected fundraising revenue by multiplying the donor count by your average gift, and adds the Average Gift slider so you can model different giving levels.

The two buttons sit at the top right of the card.
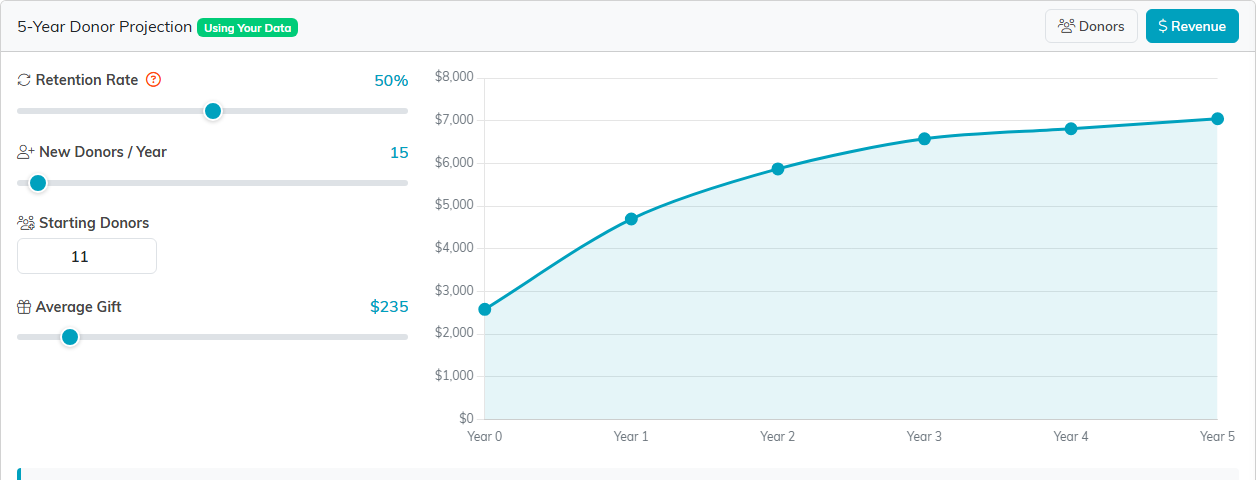
Revenue mode adds the Average Gift slider and switches the chart to dollars.
The insight and the key takeaway
Below the chart, an insight box restates the projection in plain language as you move the sliders, for example: "At 70% retention with 50 new donors/year, you'll grow from 100 to 156 donors over 5 years." Beneath it, the Key insight line shows what raising retention by up to 10 points would reach in five years, what doubling your new donors would reach, and which of the two adds more for your numbers. The answer changes with your numbers, so do not assume either one wins. Try it: set retention to 60% and note the Year 5 number, then set it to 70% and compare; then go back to 60% and double the new-donors slider instead. In almost every scenario, keeping donors beats finding new ones.

The top line follows your sliders. The blue line underneath never changes.
Ways to use it
- Board presentations - Show the projected impact of investing in retention versus acquisition.
- Goal setting - Model the retention rate you would need to hit a donor or revenue target in three to five years.
- Budget planning - Weigh the cost of retention work (thank-you calls, stewardship, personal outreach) against acquiring the same number of net-new donors.
- Benchmarking - Compare your rate to widely reported nonprofit benchmarks; donor retention is often cited in the mid-40% range, so even a small improvement compounds.